Median Employee Salary: Leetcode Pandas
In data analysis, identifying key statistical measures such as the median can provide valuable insights into employee compensation structures within companies. In this task, we’ll determine the median salary for each company, considering unique salary distributions and breaking ties using employee IDs.

Write a solution to find the rows that contain the median salary of each company. While calculating the median, when you sort the salaries of the company, break the ties by id. Return the result table in any order. The result format is in the following example.
Input:
Employee table:
+----+---------+--------+
| id | company | salary |
+----+---------+--------+
| 1  | A       | 2341   |
| 2  | A       | 341    |
| 3  | A       | 15     |
| 4  | A       | 15314  |
| 5  | A       | 451    |
| 6  | A       | 513    |
| 7  | B       | 15     |
| 8  | B       | 13     |
| 9  | B       | 1154   |
| 10 | B       | 1345   |
| 11 | B       | 1221   |
| 12 | B       | 234    |
| 13 | C       | 2345   |
| 14 | C       | 2645   |
| 15 | C       | 2645   |
| 16 | C       | 2652   |
| 17 | C       | 65     |
+----+---------+--------+
Output:
+----+---------+--------+
| id | company | salary |
+----+---------+--------+
| 5  | A       | 451    |
| 6  | A       | 513    |
| 12 | B       | 234    |
| 9  | B       | 1154   |
| 14 | C       | 2645   |
+----+---------+--------+
Explanation:
For company A, the rows sorted are as follows:
+----+---------+--------+
| id | company | salary |
+----+---------+--------+
| 3  | A       | 15     |
| 2  | A       | 341    |
| 5  | A       | 451    | <-- median
| 6  | A       | 513    | <-- median
| 1  | A       | 2341   |
| 4  | A       | 15314  |
+----+---------+--------+
For company B, the rows sorted are as follows:
+----+---------+--------+
| id | company | salary |
+----+---------+--------+
| 8  | B       | 13     |
| 7  | B       | 15     |
| 12 | B       | 234    | <-- median
| 11 | B       | 1221   | <-- median
| 9  | B       | 1154   |
| 10 | B       | 1345   |
+----+---------+--------+
For company C, the rows sorted are as follows:
+----+---------+--------+
| id | company | salary |
+----+---------+--------+
| 17 | C       | 65     |
| 13 | C       | 2345   |
| 14 | C       | 2645   | <-- median
| 15 | C       | 2645   |
| 16 | C       | 2652   |
+----+---------+--------+
Solution:
import pandas as pd

data = [[1, 'A', 2341],
        [2, 'A', 341],
        [3, 'A', 15],
        [4, 'A', 15314],
        [5, 'A', 451],
        [6, 'A', 513],
        [7, 'B', 15],
        [8, 'B', 13],
        [9, 'B', 1154],
        [10, 'B', 1345],
        [11, 'B', 1221],
        [12, 'B', 234],
        [13, 'C', 2345],
        [14, 'C', 2645],
        [15, 'C', 2645],
        [16, 'C', 2652],
        [17, 'C', 65]]
employee = pd.DataFrame(data,
                        columns=['id',
                                 'company',
                                 'salary']).astype({'id':'Int64',
                                                    'company':'object',
                                                    'salary':'Int64'})
display(employee)
Step 1. Sorting the DataFrame
Sorting Order: Primary: company (alphabetically), Secondary: salary (ascending), Tertiary: id (ascending) to break ties when salaries are equal.
- Sorting ensures that within each company, salaries are ordered from lowest to highest. Sorting by id as a tertiary key breaks ties, ensuring a consistent and reproducible order.
employee = employee.sort_values(by=['company', 'salary', 'id'])

display(employee)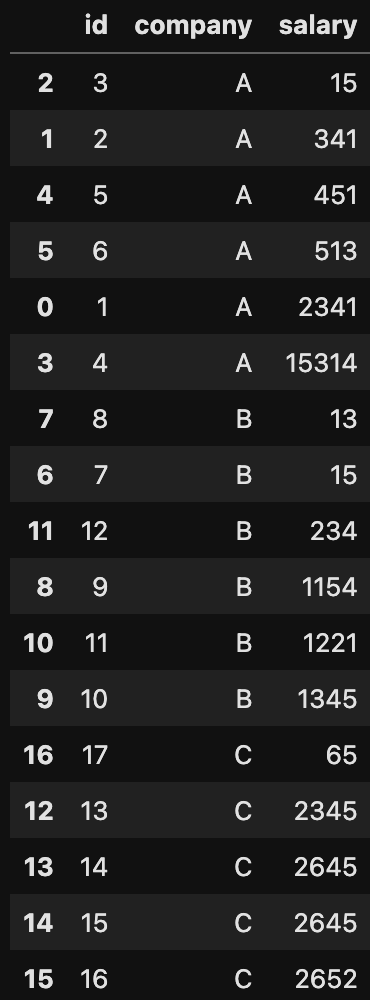
Step 2. Assigning Ranks Within Each Company
- Grouping: The groupby(‘company’) groups the DataFrame by the company column.
- Ranking: cumcount() assigns a cumulative count (starting from 0) to each row within its group.
- Adjustment: Adding 1 shifts the count to start from 1 instead of 0.
- Assigning a rank to each employee within their company based on the sorted order facilitates identifying median positions.
employee['rank'] = employee.groupby('company').cumcount() + 1

display(employee)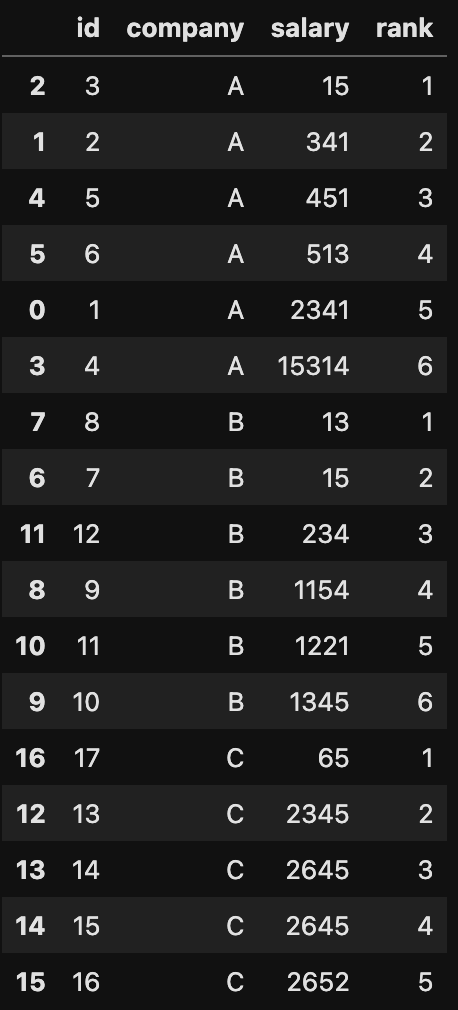
Step 3. Counting Employees per Company
- Grouping: Groups the DataFrame by company.
- Counting: Counts the number of employees (id) in each company.
- Transform: The transform(“count”) ensures that the count is broadcasted back to each row in the original DataFrame.
- Knowing the total number of employees in each company is essential for calculating the median position.
- Midpoint Calculation: Divides the total number of employees in each company by 2 to find the midpoint. The median position depends on whether the number of employees is odd or even. Calculating the midpoint helps in identifying the median positions.
employee["employee_count"] = employee.groupby(["company"])["id"].transform("count")
employee["mid"] = employee["employee_count"]/2

display(employee)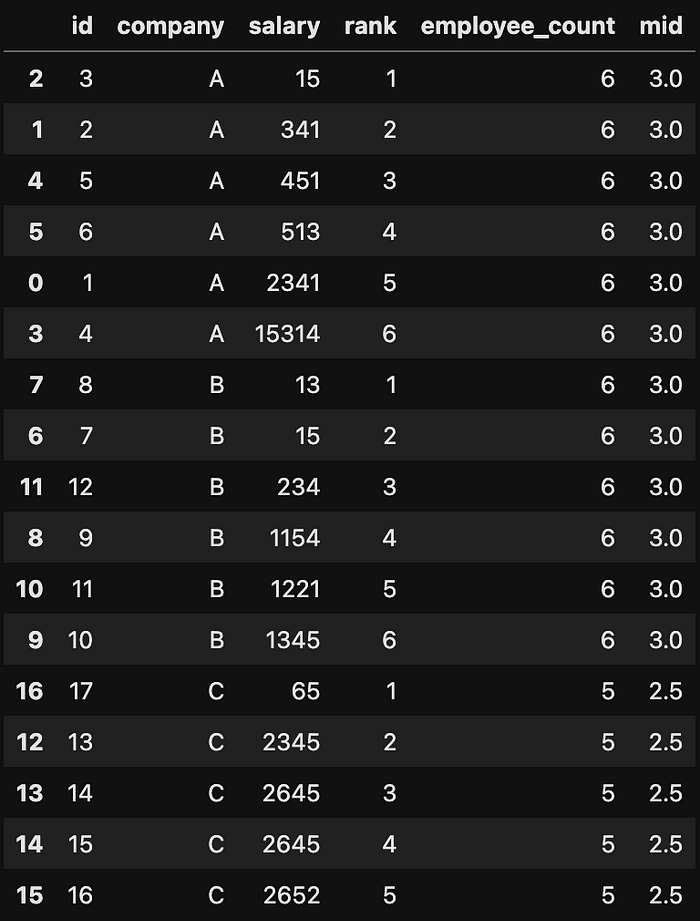
Step 4. Filtering Rows to Identify Median Salaries
- For Even Number of Employees (Companies A and B):
There are two median positions: mid and mid + 1.
Example: Company A has 6 employees. mid = 3.0. Median ranks are 3 and 4. - For Odd Number of Employees (Company C):
Since employee_count is 5, mid = 2.5, Median rank is 3
employee = employee.loc[(employee['rank'] >= employee['mid'])
                      & (employee['rank'] <= employee['mid'] + 1)]

display(employee)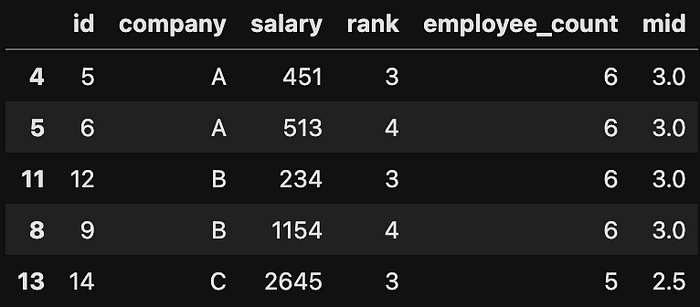
Step 6. Selecting Relevant Columns for the Final Output
employee = employee[['id', 'company', 'salary']]

display(employee)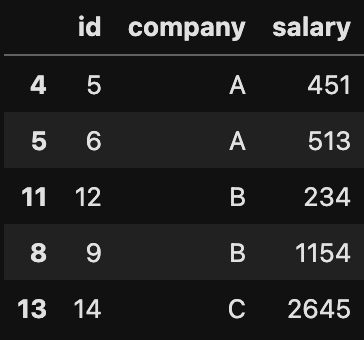
Follow me on LinkedIn Instagram Medium profile or subscribe to my email list for the latest blogs, and click the clap button to support writing. Feel free to ask questions in the comment section. Don’t forget to share the blog link with your friends or LinkedIn connections.
References: [1] Leetcode: median employee salary
[2] Full code in GitHub